Total Paid (13 months)
$4,738
May 2025 – May 2026
Total kWh Used
26,383
13-month total | avg 2,030/mo
Peak Season Peak
$780.77
Feb 2026 · 4,269 kWh · 24°F avg
Super Off-Peak Share
44%
Of kWh (9 mo. w/ tier data) · 10,074 kWh
EV Charging Savings
$1,384
Super off-peak vs. on-peak (9 months)
Monthly kWh Usage by Tier + Average Daily Temperature
Stacked by time-of-use tier. May–Aug 2025 have total kWh only (no PDF tier data available).
On-Peak kWh
Off-Peak kWh
Super Off-Peak kWh
No Tier Data
Avg Daily Temp (°F)
Monthly Bill Breakdown by Charge Type
Generation charges split by tier. "Fixed/Distrib." includes customer charge (~$11.35), distribution (~$0.066/kWh), and minor fees.
On-Peak Generation
Off-Peak Generation
Super Off-Peak Generation
Distribution + Fixed Charges
Total Bill
Super Off-Peak: Actual Cost vs. On-Peak Equivalent
Monthly cost of super off-peak usage vs. what it would have cost at on-peak generation rates. Shaded area = savings.
Actual SOP Cost
If Charged On-Peak
kWh Distribution by Tier
9-month total (Sep 2025–May 2026) · 22,837 kWh
On-Peak
3,242 kWh 14.2%
Off-Peak
9,521 kWh 41.7%
Super Off-Peak
10,074 kWh 44.1%
Rate Schedule — ME-RESF Time-of-Use
Current generation rates (effective Dec 1, 2025). Previous rates: On-Peak $0.2031, Off-Peak $0.0999, Super Off-Peak $0.0740/kWh. Distribution charge (~$0.0663/kWh) applies equally to all tiers. Periods do not change seasonally.
On-Peak
$0.2212/kWh
Generation charge only
All-in ≈ $0.289/kWh
🕑 2:00 pm – 9:00 pm
Monday – Friday only
Monday – Friday only
Avoid scheduling EV charging
or heavy loads during these hours
or heavy loads during these hours
Off-Peak
$0.1089/kWh
Generation charge only
All-in ≈ $0.176/kWh
🕘 6:00 am – 2:00 pm
+ 9:00 pm – 11:00 pm
Mon–Fri & all day weekends
+ 9:00 pm – 11:00 pm
Mon–Fri & all day weekends
51% cheaper than on-peak
All hours not on-peak or super off-peak
All hours not on-peak or super off-peak
Super Off-Peak
$0.0806/kWh
Generation charge only
All-in ≈ $0.148/kWh
🌙 11:00 pm – 6:00 am
Every day, year-round
Every day, year-round
64% cheaper than on-peak
Ideal window for EV charging
Ideal window for EV charging
* Source: FirstEnergy PA Time-of-Use Pricing. Periods are the same year-round with no seasonal adjustments. Distribution System Improvement Charge, Default Service Support Charge, LED Conversion Charge, and State Tax Surcharge are additional small per-kWh fees.
⚡
EV Charging — Home Sessions
Home Sessions (PA) Only · Supercharger & MD sessions excluded · Data via Tessie
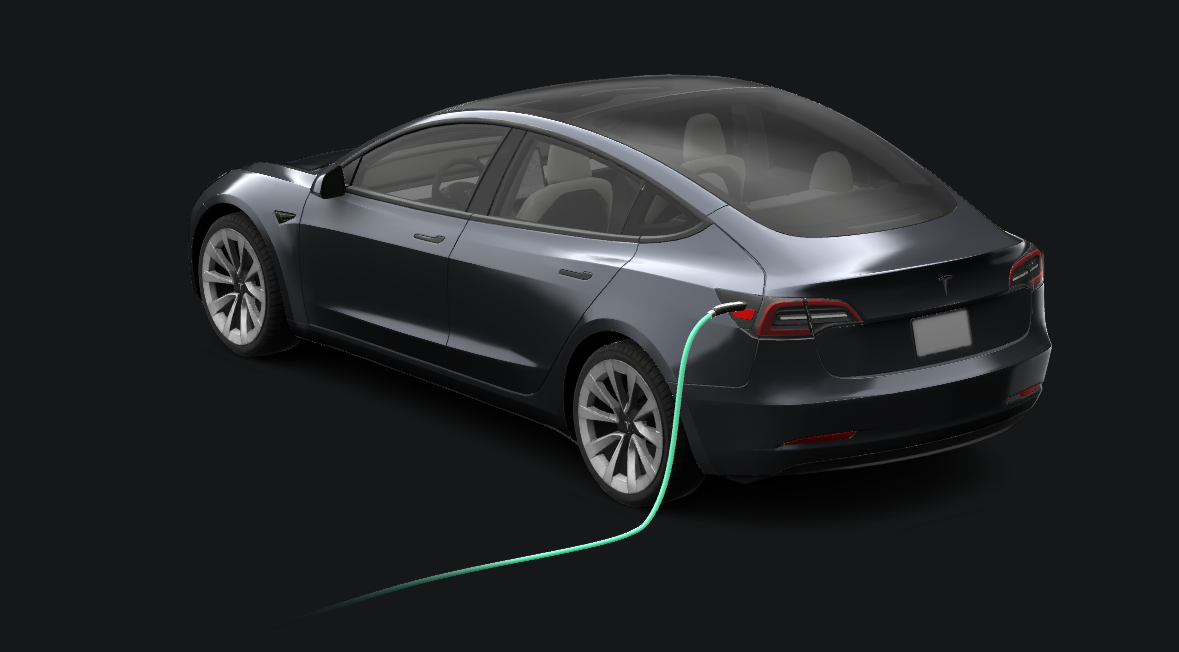 2021 Model 3
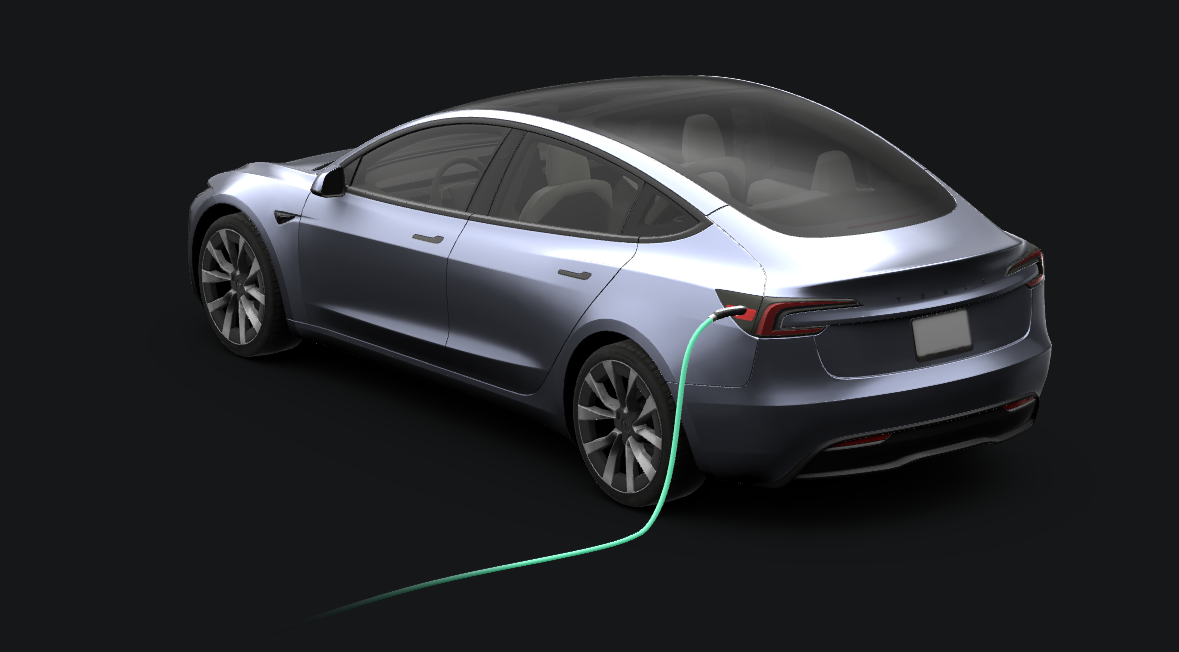 2026 Model 3
Loading…
—
Monthly Home Charging — kWh by Vehicle
Wall kWh drawn (energy_used). 2026 Model 3 data starts May 2026.
2021 Model 3
2026 Model 3
Cost per Mile — Monthly
Combined fleet. Total generation cost ÷ miles added from home charging that month.
Recent Home Charging Sessions
Loading…
| Date | Vehicle | Start | End | kWh Used | On-Peak kWh | Off-Peak kWh | SOP kWh | Miles Added | Cost |
|---|
* Showing most recent 30 sessions. Cost = generation (TOU rate) + delivery ($0.0663/kWh). 2021 data: Jun 2024–May 2026. 2026 data: May 2026.
Monthly Bill Detail
Full data from all bills. Savings = super off-peak actual cost vs. equivalent at on-peak generation rate.
| Bill Period | Days | Avg Temp | Total kWh | On-Peak kWh | Off-Peak kWh | Super Off-Peak kWh | SOP Cost | SOP @ On-Peak | Monthly Savings | Total Bill |
|---|---|---|---|---|---|---|---|---|---|---|
| May 2025 | 29 | 61°F | 914 | — | — | — | — | — | — | $150.89 |
| Jun 2025 | 32 | 64°F | 887 | — | — | — | — | — | — | $149.19 |
| Jul 2025 | 30 | 77°F | 823 | — | — | — | — | — | — | $151.96 |
| Aug 2025 | 29 | 78°F | 922 | — | — | — | — | — | — | $170.35 |
| Sep 2025 | 33 | 72°F | 1,469 | 225 | 683 | 560 | $41.43 | $113.72 | $72.29 | $261.41 |
| Oct 2025 | 29 | 69°F | 1,713 | 250 | 580 | 883 | $65.32 | $179.31 | $113.99 | $295.87 |
| Nov 2025 | 33 | 53°F | 1,495 | 257 | 698 | 540 | $39.95 | $109.65 | $69.70 | $269.67 |
| Dec 2025 | 29 | 38°F | 3,096 | 481 | 1,320 | 1,295 | $98.78 | $271.15 | $172.37 | $547.56 |
| Jan 2026 | 30 | 32°F | 3,547 | 591 | 1,625 | 1,331 | $107.25 | $294.41 | $187.16 | $656.19 |
| Feb 2026 | 31 | 24°F | 4,269 | 587 | 1,926 | 1,756 | $141.49 | $388.40 | $246.91 | $780.77 |
| Mar 2026 | 29 | 36°F | 3,128 | 432 | 1,208 | 1,487 | $119.82 | $328.90 | $209.08 | $569.51 |
| Apr 2026 | 29 | 50°F | 1,997 | 219 | 742 | 1,036 | $83.48 | $229.14 | $145.66 | $359.15 |
| May 2026 | 33 | 58°F | 2,123 | 200 | 737 | 1,186 | $95.56 | $262.32 | $166.76 | $375.12 |
| TOTAL / 13 months | — | — | 26,383 | 3,242 | 9,521 | 10,074 | $793.08 | $2,177.00 | $1,383.92 | $4,737.64 |
* Savings calculated on generation charges only (distribution + fixed charges are the same regardless of when you use power). SOP savings vs on-peak = (onPeakGenRate − sopGenRate) × sopKwh. Pre-Dec 2025 rates used for Sep–Nov; Dec uses weighted split; post-Dec rates for Jan–May.